
1. INTRODUCTION
Anthropometry is a study that involves the measurement of the human body dimensions and its implication in medical science. The term anthropometry refers to a set of systematized measuring techniques for expressing quantitatively the dimensions of the human body and skeleton (Shah et al., 2023).
Naso-facial anthropometry is a branch of anthropometry that deals with the measurement of the facial and nasal region. It aids in reconstruction of congenital or post-traumatic facial disfigurement, helps in diagnosing facial deformities, forensic science, and in the determination of gender (Minh and Truong, 2023).
The face and nose are shaped during embryonic development and are influenced by genetic, environmental, and cultural factors. Certain studies have classified human faces and noses based on their indices (Omotoso et al., 2019; Piombino et al., 2020; Zar et al., 2023). However, there is want of a study on how the nose and face relate to each other—that is, whether certain nasal dimensions are consistently associated with particular facial dimensions among Urhobos.
Understanding the relationship between the face and nose is important. Forensic experts could use such data for personal identification, surgeons could rely on it to design more suitable reconstructive procedures, and anthropologists could use it to document ethnic variation within Nigeria.
This study examined the relationship that exist between nasal and facial parameters and provide data specific to Urhobo ethnic group. The morphometric relationships established contributes significantly to the understanding of Urhobo craniofacial characteristics and have practical implications for surgical planning, forensic investigations and anthropological profiling.
2. MATERIALS AND METHODS
Ethical approval was obtained from the Faculty of Basic Medical Sciences Ethical Committee, Delta State University, Abraka, Delta State, Nigeria. Informed consent was secured from all participants. The participants consist of males and females between the ages of 18 and 30years.
A descriptive cross-sectional design was adopted. A total of 300 Urhobo students (149 males and 151 females), aged 18–30 years, were selected through cluster sampling at Delta State University, Abraka.
Inclusion Criteria: Participators were of Urhobo ethnicity up to two generations. Participators who gave consent.
Exclusion Criteria: Participators with craniofacial disorders. Subjects with history of facial surgery and nose surgery. Participators with facial trauma.
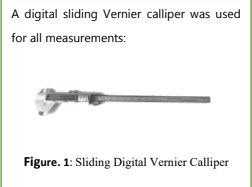
The following parameters were taken,
i. The nasal width is the distance from the ala of one side of nose to the ala of the other side and nasal height is the distance from the nasion (a fixed point between the eyes) to the subnasale (nasolabial junction) (Premraj et al., 2025).
ii. Maximum Facial Height (MFH) is the distance between nasion to the gnathion and maximum facial breadth (MFB) is the distance between the two zygomatic prominences (Thakur et al., 2025).
Indices calculated: Facial Index (FI) = (Facial height / Facial width) × 100. Nasal Index (NI) = (Nasal width / Nasal height) × 100.
Data were analysed using SPSS version 25. Mean, standard deviation, independent t-tests, paired t-test, and Pearson correlation coefficients were used. Significance was set at p < 0.05.
3. RESULTS
| Gender | Frequency | Percentage (%) |
|---|---|---|
| Male | 149 | 49.7 |
| Female | 151 | 50.3 |
| Total | 300 | 100 |
Table 1 shows the total sample of 300 subjects, unequally distributed.
| N | Minimum | Maximum | Mean | Standard Deviation | |
|---|---|---|---|---|---|
| Age | 300 | 18 | 31 | 20.45 | 2.35 |
| Nose Width | 300 | 28.89 | 48.66 | 37.53 | 3.44 |
| Nose Height | 300 | 37.39 | 70.31 | 48.12 | 7.49 |
| Face Width | 300 | 46.95 | 143.68 | 124.54 | 8.47 |
| Face Height | 300 | 94.81 | 143.88 | 114.99 | 9.67 |
| Facial Index | 300 | 41.09 | 139.46 | 109.04 | 11.47 |
| Nasal Index | 300 | 52.27 | 118.28 | 79.40 | 11.56 |
The descriptive statistics in table 2 showed anthropometric data of the subjects studied.
| Parameter | Gender | N | Mean | Standard Deviation | t- test | p-value |
|---|---|---|---|---|---|---|
| Nose Width | M | 149 | 38.61 | 3.33 | 5.68 | 0.000* |
| Nose Width | F | 151 | 36.47 | 3.22 | ||
| Nose Height | M | 149 | 48.17 | 6.72 | 0.13 | 0.899 |
| Nose Height | F | 151 | 48.06 | 8.21 | ||
| Face Width | M | 149 | 126.32 | 9.32 | 3.69 | 0.000* |
| Face Width | F | 151 | 122.79 | 7.14 | ||
| Face Height | M | 149 | 117.63 | 8.68 | 4.88 | 0.000* |
| Face Height | F | 151 | 112.38 | 9.90 | ||
| Facial Index | M | 149 | 107.96 | 11.22 | -1.63 | 0.104 |
| Facial Index | F | 151 | 110.11 | 11.65 | ||
| Nasal Index | M | 149 | 81.30 | 10.83 | 2.86 | 0.004* |
| Nasal Index | F | 151 | 77.52 | 11.97 |
Table 3 showed presence of sexual dimorphism in anthropometric parameters of the subjects studied. Nose width, face width, face height and nasal index in male was significantly higher than that of female except for nose height and facial index.
| Parameter | N | Mean | Standard Deviation | t- test | p-value |
|---|---|---|---|---|---|
| Nose Width | 300 | 37.53 | 3.44 | -25.12 | 0.000* |
| Nose Height | 300 | 48.12 | 7.49 | ||
| Face Width | 300 | 124.54 | 8.47 | 12.90 | 0.000* |
| Face Height | 300 | 114.99 | 9.67 |
Table 4 showed significant difference between measured anthropometric parameters.
| Parameter | Statistic | Age | Nose Width | Nose Height | Face Width | Face Height | Facial Index | Nasal Index |
|---|---|---|---|---|---|---|---|---|
| Age | Pearson Correlation | 1 | 0.034 | 0.128 | -0.001 | 0.123 | -0.093 | -0.094 |
| Age | Sig. (2-tailed) | 0.552 | 0.027* | 0.983 | 0.033* | 0.106 | 0.105 | |
| Nose Width | Pearson Correlation | 0.034 | 1 | 0.285 | 0.178 | 0.360 | -0.163 | 0.359 |
| Nose Width | Sig. (2-tailed) | 0.552 | 0.000* | 0.002* | 0.000* | 0.005* | 0.000* | |
| Nose Height | Pearson Correlation | 0.128 | 0.285 | 1 | -0.157 | 0.815** | -0.710** | -0.780** |
| Nose Height | Sig. (2-tailed) | 0.027* | 0.000* | 0.006 | 0.000* | 0.000* | 0.000* | |
| Face Width | Pearson Correlation | -0.001 | 0.178 | -0.157 | 1 | 0.004 | 0.633** | 0.258 |
| Face Width | Sig. (2-tailed) | 0.983 | 0.002* | 0.006 | 0.950 | 0.000* | 0.000** | |
| Face Height | Pearson Correlation | 0.123 | 0.360 | 0.815** | 0.004 | 1 | -0.766** | -0.561** |
| Face Height | Sig. (2-tailed) | 0.033* | 0.000* | 0.000* | 0.950 | 0.000* | 0.000* | |
| Facial Index | Pearson Correlation | -0.093 | -0.163 | -0.710** | 0.633** | -0.766** | 1 | 0.587** |
| Facial Index | Sig. (2-tailed) | 0.106 | 0.005* | 0.000* | 0.000* | 0.000* | 0.000* | |
| Nasal Index | Pearson Correlation | -0.094 | 0.359 | -0.780** | 0.258 | -0.561** | 0.587** | 1 |
| Nasal Index | Sig. (2-tailed) | 0.105 | 0.000* | 0.000* | 0.000* | 0.000* | 0.000* |
Table 5 showed strong positive correlation between nasal height and facial height. Facial width correlated with facial index, while nasal width correlated with both facial and nasal indices.
| Classes | Range | Males (%) | Females (%) |
|---|---|---|---|
| Hypereuryprosopic | ≤78.9 | 1(0.67) | 1(0.66) |
| Euryprosopic | 79.0 - 83.9 | 2(1.34) | |
| Mesoprosopic | 84.0 - 87.9 | 4(2.69) | 8(5.30) |
| Leptoprosopic | 88.0 - 92.9 | 9(6.04) | 9(5.96) |
| Hyperleptoprosopic | ≥100.0 | 133(89.26) | 133(88.08) |
Table 6 shows that the prevalent face shape was hyperleptoprosopic for both genders; while the rarest was hypereuryprosopic for both genders.
| Classes | Range | Males (%) | Females (%) |
|---|---|---|---|
| Hyperleptorrhine | ≤54.9 | ||
| Leptorrhine | 55.0 - 69.9 | 21(14.09) | 39(25.83) |
| Mesorrhine | 70.0 - 84.9 | 80(53.69) | 77(50.99) |
| Platyrrhine | 85.0 - 99.9 | 41(27.52) | 28(18.54) |
| Hyperplatyrrhine | ≥100.0 | 7(4.7) | 7(4.64) |
Table 7 shows that the prevalent nose shape was mesorrhine for both genders. However, the rarest was hyperplatyrrhine for both genders.
4. DISCUSSION
The study cconsidered three hundred (300) subjects, consisting of one hundred and forty-nine (149) males and one hundred and fifty-one (151) females which is in line with Srinivasan (2020), who reported equal number of males and females. However, this research differed from that of Ukoha et al. (2016) and Debnath et al. (2023), who reported unequal number of males and females. Such differences may be explained by variations in sampling techniques.
The results of this study showed that males had significantly larger nose width, face width, and face height than females, with no significant gender difference in nose height or facial index. This observation is in line with the reports from Ray et al. (2016), Anup and Atreya (2018), and Sunita et al. (2024), who found larger facial and nasal dimensions in males. Sudikshya et al. (2019) found male values were larger, but no significant difference in nasal and facial indices, similar to the present study’s non-significant gender difference in facial index.
Based on the result of this study, significant difference was observed among parameters having the mean nose height as 48.12mm and mean nose width (37.53mm), while the mean face width (124.54mm) was higher than the mean face height (114.99mm) with p < 0.000 which was statistically significant. These findings of this study align with the findings of Tanko et al. (2019), Maitreyee et al. (2019) and Sarkodie et al. (2022) who observed significant difference among parameters.
The most prevalent face type among gender was hyperleptoprosopic which is in line with results from Sarkodie et al., (2021) among Ghanaians, as well as Anibor et al. (2022) among the Ika ethnic group in Delta State. This finding suggests a general trend of elongated facial profiles within certain West African groups.
For nose type, the mesorrhine classification was found dominant among gender which aligns with Maitreyee et al., (2019) in India and Sunita et al. (2024) in Rajasthan, India. This suggests a possible convergence of nasal morphology in tropical and subtropical climates where moderate nasal indices are adaptive.
The strong correlation between nasal height and facial height also supports the findings by Sonny and John (2021) who reported a similar positive correlation among the Ikwerre people of Rivers State, Nigeria. The relationship between nasal and facial dimensions underscores the anatomical harmony and developmental interdependence of facial features.
However, though facial and nasal indices correlated positively, nose height had an inverse relationship with nasal index, indicating that taller noses are generally narrower.
This morphometric data is crucial for plastic surgeons, forensic analysts, and anthropologists. It established the database of normative facial parameters for the Urhobo people, which can guide aesthetic standards and identity reconstruction.
5. CONCLUSION
This study has provided baseline data on naso-facial dimensions among the Urhobo ethnic group in Delta State, Nigeria. Findings show significant gender differences in most facial and nasal parameters. A strong correlation occurred between nose and face dimensions. High prevalences of hyperleptoprosopic face and mesorrhine nose types were divulged.
References
- [1] Anibor E, Etetafia MO, Isho P and Inikoro C. (2022). Facial types and morphology: A study among Ika subjects in Delta State, Nigeria. International Journal of Health Sciences, 6(S2): 1416-1427.
- [2] Barma MD, Ahlawat H and Ankita. (2022). Study on Measurement of Facial Index To Determine The Type Of Face In Healthy Population In Vidarbha Region Of Central India. International Journal of Current Science. 12(4): 954-962.
- [3] Debnath S, Thakur KK, Sharma R, Sharma Y, Balowria K, Gupta K and Gupta J (2023). Anthropometric study of facial index in the medical students of Doda, Jammu and Kashmir. International Journal of Life Sciences Biotechnology and Pharma Research. 12(2): 469-471.
- [4] Maitreyee MK,, Jagdish SS and Shital BH (2019). An anthropometric study of nasal index with its clinical correlation. International Journal of Anatomy and Research. 7(2.1): 6377-6380.
- [5] Minh TN and Truong TN (2023). The Anthropometric Measurement of Nasal Landmark Locations by Digital 2D Photogrammetry Using the Convolutional Neural Network. Diagnostics. 13(891): 1-16.
- [6] Omotoso RD, Adagbonyin O, Bienonwu E and Uwagbor V (2019). Anthropometric Evaluation of Nasal Height, Nasal Breadth and Nasal Index among Bini Children in Southern Nigeria. International Journal of Anatomy and Research. 7(3.2): 6896-6900.
- [7] Piombino P, Zace P, Grassia MG, Cataldo R, Marino, M, De Riu, G, Testa D, Bonavolonta P and Califano L (2020). Anthropometric Parameters for Nose Evaluation and Nasal Surgery Planning. The Journal of Craniofacial Surgery. 31(6): 1620-1624.
- [8] Rushikesh P and Sushant T (2021). Study of nasal index. Journal of Forensic Research. 12(9): 1-4.
- [9] Sarkodie FK, Abaidoo C S, Tetteh J, Adjei-Antwi C and Okwan DK (2022). Facial indices and morphology: A study among Bono and Ewe adult population in the Bono region, Ghana. Scientific African. 15; 1-7.
- [10] Shah SB, Chavda SR, Purohit BJ. and Vora RK (2023) An Anthropometric Study of Nasal Index among Indians in Gujarat. International Journal of Academic Medicine and Pharmacy. 5 (5): 882-885.
- [11] Sonny CO and John NP (2021). Is There A Relationship between the Facial and Nasal Height of the Ikwerre People.? Scholars International Journal of Anatomy and Physiology. 4(5): 59-64.
- [12] Sudikshya KC, Shrestha S and Bhattarai L (2019). Nasal Parameters and Facial Index in Medical Undergraduates: A Cross Sectional Study. Journal of Lumbini Medical College.7 (2): 81-87.
- [13] Sunita A, Bhavana S, Kishore BV and Bhupesh M (2024). Anthropometric Comparison of Nasal Parameters in Male and Female Students-A Cross-Sectional Study. Journal of Population Therapeutics & Clinical Pharmacology. 31(6): 1287-1294.
- [14] Tanko M, Mohammed S, Akpulu SP, Sadeeq AA, Timbuak JA, Mustapha M and Bauchi ZM (2019). Nasofacial Anthropometric Study among Nupe Ethnic Group, Nigeria. International Journal of Scientific and Research Publications. 9(8): 883-886.
- [15] Ukoha UU, Egwu OA, Ndukwe GU, Akudu LS and Umeasalugo K E. Anthropometric study of the nose in a student population. Annals of Bioanthropology. 4(1): 8-11.
- [16] Zar MS, Rubab T, Qureshi MZ, Khan MA, Akhtar MS and Nowak O (2023). Anthropometric Study of the Human Craniofacial Morphology among different castes of Punjab Pakistan. Advancements in Life Sciences. 10(2): 216-222.